
Tourism Trade Show ROI: A KPI Framework for DMOs and Event Organisers
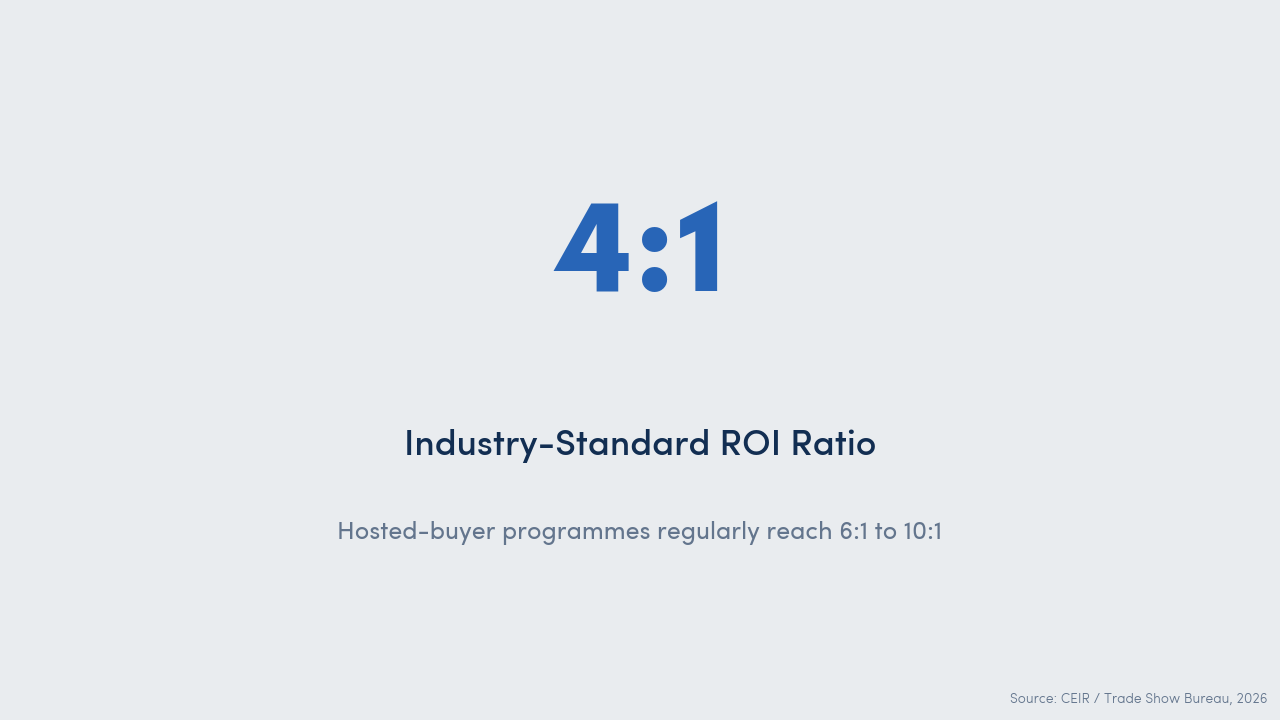
The Center for Exhibition Industry Research (CEIR) reports that well-run trade shows deliver a 4:1 revenue-to-investment ratio. That number is comforting, but it is also written from the exhibitor’s chair. As a Destination Marketing Organisation (DMO), a convention bureau or the host of a tourism trade show, you do not answer to a brand manager. You answer to a tourism ministry, a regional government or an EU funding programme. The same generic guidance does not survive contact with that audience.
The good news is that the framework you need already exists in pieces. CEIR provides exhibitor-side benchmarks. Destinations International publishes a standard ROI formula for DMOs. Swapcard’s 2026 trend report quantifies what AI matchmaking does to meeting acceptance rates. The work is putting those pieces into a single, organiser-grade KPI framework that you can run before, during and after every edition of your show, and report in formats that satisfy a public-sector funder.
In this article you will get a three-phase KPI framework, a multi-stakeholder ROI model that treats your organisation, your sellers and your hosted buyers as separate return streams, a worked example with real DMO numbers and a short section on how to communicate the result upstream.
TL;DR: Tourism Trade Show ROI in 60 Seconds
Tourism trade show ROI measures the financial and strategic value a DMO, convention bureau or destination generates by organising a B2B trade show, relative to its total investment. It combines exhibitor-style direct ROI (revenue divided by investment) with public-sector accountability metrics: visitor spending attributable to qualified buyer matches, multi-stakeholder satisfaction and destination economic impact. Unlike exhibitor ROI, it tracks three rates of return at once — organiser, seller, buyer — across three measurement phases: pre-event, during-event and post-event.
What Is Tourism Trade Show ROI?
Trade show ROI as a generic concept is decades old. The CEIR (Center for Exhibition Industry Research) baseline formula reads: ROI equals revenue minus investment, divided by investment. A B2B trade show that returns four dollars in revenue for every dollar spent is generally considered to be on benchmark.
For a DMO or convention bureau that organises a tourism trade show, that formula is necessary but not sufficient. You are not selling product at a booth. You are convening a market: you bring qualified buyers (tour operators, MICE agencies, corporate travel buyers) and qualified sellers (hotels, venues, regional experience providers) into a structured pre-scheduled meeting programme, and you carry public accountability for the outcome. Your ROI is layered.
Three things make the calculation specific to tourism trade shows:
- Three rates of return, not one: The organiser, the seller and the buyer each measure ROI differently. A well-designed report shows all three.
- Public-sector accountability: A DMO answers to a tourism ministry, a regional government or an EU funding programme. Buyer-by-buyer attribution and destination economic impact matter alongside revenue.
- Long booking cycles: A qualified buyer-seller meeting at a tourism trade show often converts into a booking three to nine months later. Your ROI measurement window has to match the booking cycle, not the marketing cycle.
According to The Business Research Company’s MICE Global Market Report 2026, the meetings, incentives, conferences and exhibitions market is valued at USD 1,148.72 billion in 2026 and is projected to reach USD 1,558.24 billion by 2035 at a 7.9 per cent CAGR (compound annual growth rate). Public scrutiny on how that money is spent is rising in parallel.
Why Tourism Trade Shows Need Their Own ROI Framework
Generic trade show ROI guidance is written for the exhibitor: the company that books a booth, sends a sales team and counts badge scans. The tourism trade show organiser sits in a different chair. Three differences matter.
Multi-stakeholder reporting: When a hosted buyer flies in from Singapore to meet a regional hotel collective in your destination, three parties expect a return. Your seller wants qualified meetings that become bookings. Your buyer wants a curated list of suppliers worth their time. You want a healthy event that justifies your operating budget. A single ROI number cannot tell that story honestly.
Public-sector accountability: Destinations International, the global DMO industry body, publishes a Standard DMO Performance Reporting Handbook. It defines DMO ROI as visitor spending generated by the DMO’s efforts divided by total DMO operating costs, plus a separate tax-return-on-public-funding metric. That framing is alien to a generic Cvent or JOOR guide, but it is what your funders will ask about.
Long booking cycle: Industry data suggests that hosted-buyer-programme meetings convert into actual bookings on a three-to-nine-month horizon, with some destination contracts running on annual cycles. CEIR research cited by The Consultancy Group in 2025 shows that exhibitors typically convert 20 per cent of leads into customers within six months. For tourism trade shows you should plan three measurement windows: 90 days for leading indicators, six months for booking-conversion baselines and twelve months for renewal signals.
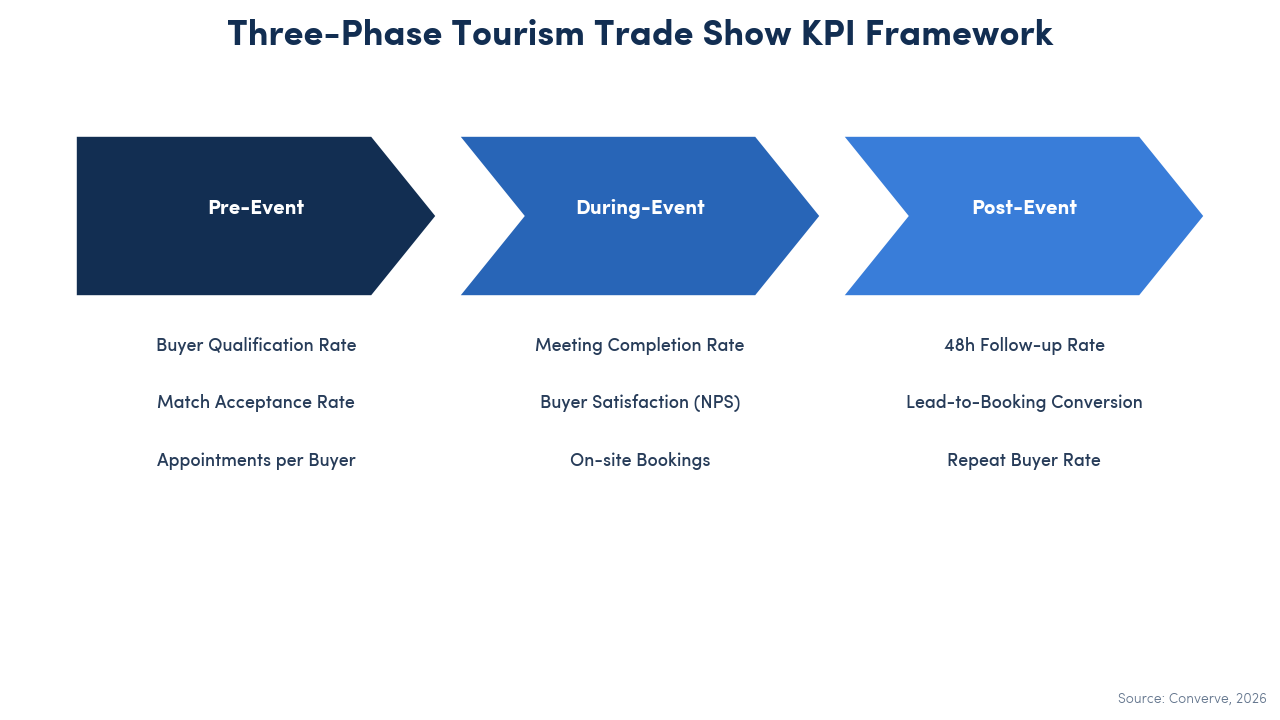
The Three-Phase KPI Framework
The framework below puts every measurable input and outcome into one of three phases. Track them with the same data points every edition, and year-on-year comparison becomes trivial.
Phase 1 — Pre-Event KPIs (Inputs and Quality of the Match)
- Buyer Qualification Rate: Of all buyer applications, what share passes your vetting (budget authority, project pipeline, destination relevance). The CEIR exhibitor study sets 39 per cent as the lead-qualification benchmark for B2B exhibitions. Hosted buyer programmes should be much higher because you control the filter.
- Seller Sign-up and Coverage: The number of sellers in each destination sub-segment (hotels, MICE, experiences). Coverage gaps mean buyers will go home with unfulfilled briefs.
- Meeting Request Volume: The total number of meeting requests submitted by buyers and sellers in the pre-event period. Volume signals event-market fit; thin volume signals a brief that is not landing.
- Pre-Scheduled Appointments per Buyer: Your programme quota is the floor. A useful scale benchmark: the U.S. Travel Association’s IPW runs more than 100,000 pre-scheduled appointments across 1,400 international buyers each year (Ezus.io, 2026).
- AI Match Acceptance Rate: If you run matchmaking software, this is the share of meeting requests that turn into confirmed appointments. Swapcard’s 2026 trend report shows that at organisations without AI matchmaking, 65 to 75 per cent of requests go unanswered, and that AI matchmaking can double the acceptance rate, with Tier-1 requests reaching close to 100 per cent acceptance.
Phase 2 — During-Event KPIs (Execution and Stakeholder Experience)
- Meeting Completion Rate: Of the confirmed appointments, the share that actually happen. Hosted buyer programmes typically hit the high seventies; open registration sits much lower. Drop-off between confirmation and meeting is a red flag for buyer fatigue or over-scheduling.
- On-Time Attendance: The share of meetings that start within five minutes of their scheduled slot. A practical indicator of programme discipline.
- Buyer Satisfaction Score (NPS): Net Promoter Score collected during or immediately after the event from the hosted buyer cohort. Below 30 means the matchmaking quality is hurting your renewal pipeline.
- Seller Bookings Captured On-Site: Bookings (or strongly committed letters of intent) closed during the event itself. Underestimated because most reporting only counts post-event bookings.
- Floor Engagement Time per Buyer: Aggregate minutes a hosted buyer spends in scheduled meetings versus open-floor wandering. A leading indicator of buyer ROI.
Phase 3 — Post-Event KPIs (Conversion and Renewal)
- Follow-Up Response Rate (within 48 hours): The share of meetings that produce a documented follow-up email or quote within 48 hours. Sales-cycle research published on the Live Life Indo blog in April 2026 calls this the critical 48-hour post-show window.
- Lead-to-Booking Conversion Rate (90 days): The share of qualified meetings that turn into a contracted booking within 90 days. Use the same CRM definition every year.
- Repeat Buyer Rate (year on year): Of last year’s hosted buyer cohort, the share returning this year. Above 60 per cent signals a healthy event; below 40 per cent is a structural warning.
- Visitor Spending Attributed to Buyer Matches: The destination-economic-impact metric. This is the bridge to the Destinations International DMO ROI formula.
- Net Promoter Score (combined buyer + seller): A single number that travels well into ministry decks. Track separately and combined.
Multi-Stakeholder ROI: Three Streams, One Event
Every tourism trade show produces three returns at once. A serious ROI report walks each of them in turn.
Organiser ROI: What your DMO or convention bureau gets back. The headline number is the Destinations International formula: visitor spending generated by your event divided by your operating cost. Layer in revenue (registration fees, sponsorship, exhibitor packages) minus the full cost stack (venue, technology platform, hosted buyer travel, staff). Add the renewal-rate signal — your single best leading indicator for next year’s budget conversation.
Seller ROI: What your hotels, venues and experience providers get back. Track qualified meeting count per seller, booking value per meeting and cost per qualified lead. According to ExpoContratista’s 2026 ROI guide, the average cost per lead at a trade show is 38 per cent lower than a traditional sales call, citing Trade Show Bureau data. Your sellers should see that comparison spelled out.
Buyer ROI: What your hosted buyers get back. Time-to-qualified-supplier (how many meetings it took to find a real fit), bookings made per day in the destination, satisfaction with curation quality. Buyer ROI is the most under-measured of the three, and it is the metric that drives next year’s renewal directly.
| KPI | Organiser / DMO | Seller | Hosted Buyer |
|---|---|---|---|
| Headline metric | Visitor spending / cost | Qualified meetings | Suppliers per day |
| Supporting metric | Renewal rate | Booking value / meeting | Curation NPS |
| Public reporting | Tax return on funding | Cost per qualified lead | Bookings per day |
The ROI Formula in Practice — A Worked Example
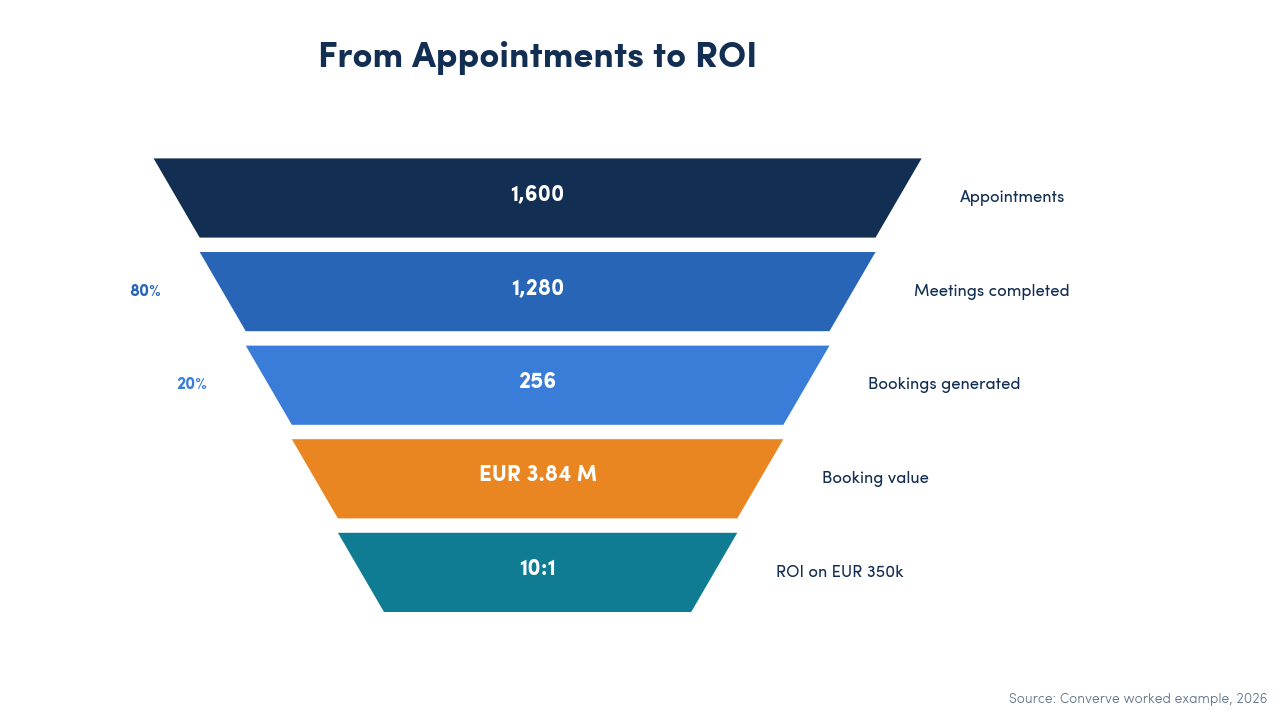
Numbers make the framework operational. Take a realistic profile: a national DMO running an annual inbound hosted-buyer show.
- 200 hosted buyers qualified and flown in
- 800 sellers from the destination on the floor
- Two days of scheduled meetings, with four meeting slots per buyer per day
- Platform, production, hosted buyer travel and staff investment: EUR 350,000
- Average booking value per converted meeting: EUR 15,000
The math runs as follows. Total pre-scheduled appointments equal 200 buyers times four slots times two days, which is 1,600 appointments. At a healthy 80 per cent completion rate, 1,280 meetings actually happen. At a 20 per cent lead-to-booking conversion (the CEIR six-month benchmark), 256 bookings result. Multiplied by the EUR 15,000 average booking value, the total bookings value generated by the event is EUR 3.84 million.
Apply the standard ROI formula: ROI equals (EUR 3,840,000 minus EUR 350,000) divided by EUR 350,000, which equals roughly 9.97, or close to a 10:1 return.
Two things matter about this example. First, a 10:1 return is well above the 4:1 industry benchmark — but that is normal for a well-run hosted buyer programme, because pre-qualified meetings are intrinsically higher-converting than open-registration walk-ups. Second, this calculation captures only the direct booking value. The Destinations International DMO ROI formula would add destination economic impact (the multiplier effect of the hotel nights, restaurant spending and onward bookings those 256 contracts generate), which would push the public-funding-relevant return much higher.
Reporting ROI Upstream — A Note for DMOs
If your funder is a tourism ministry, a regional government or an EU programme, the way you frame the number matters as much as the number itself.
Lead with the Destinations International formula. Visitor spending generated divided by DMO operating cost is the language your funder understands. The Tax Return on Public Funding metric (taxes produced by DMO-generated visitor spending divided by total public funding) is the close second.
Show buyer-by-buyer attribution. A funder rarely wants the aggregate; they want to know which sub-segment of inbound buyers produced the highest visitor-spending multiplier. A clean buyer-segmentation table with origin country, sub-vertical and attributed bookings answers questions before they are asked.
Make data handling defensible. Hosted buyers from 70 countries means General Data Protection Regulation (GDPR) compliance is your baseline. Choose a matchmaking platform that handles consent, regional data residency and right-to-erasure cleanly. A funder audit that surfaces a data-handling issue will undo a strong ROI report overnight.
For the methodology behind running the hosted buyer programme that feeds these numbers, read our step-by-step guide to running a hosted buyer programme, and for the format choice that drives match acceptance see hosted buyer programme versus open registration.
How AI Matchmaking Changes Tourism Trade Show ROI
The most measurable ROI lift available to a tourism trade show organiser in 2026 is the matchmaking quality of the platform you choose. The data is unambiguous.
Swapcard’s 2026 trend report shows AI matchmaking doubles meeting acceptance rates compared with rule-based or manual matching. Clarion Events, a major B2B trade show operator, publicly reported a 44 per cent increase in in-person meetings after introducing AI matchmaking, according to coverage in Meetings & Incentive Travel cited by Event Tech Live in 2026. ExpoMax trade shows reported a 35 per cent improvement in traffic management through AI forecasting in the same period.
Translate that into the worked example above. A doubling of meeting acceptance from a baseline 50 per cent to 90 per cent does not just mean more meetings; it pulls the completion rate up because pre-accepted matches show up more reliably. Even modest acceptance lift moves the lead-to-booking conversion number, which is the variable with the largest ROI leverage in the formula.
Solution: Converve’s matchmaking is built around the meeting matrix that hosted buyer programmes actually run — buyer interests, seller offerings, schedule constraints and language preferences resolved in a single layer. DMOs use it for inbound hosted buyer programmes where buyer-by-buyer attribution and GDPR-clean reporting are mandatory. For a deeper comparison of platforms designed for tourism trade shows, see the best matchmaking software for tourism trade shows (2026).
Conclusion
Tourism trade show ROI is not an exhibitor metric scaled up. It is a different framework: three rates of return measured across three phases, reported in a language your public-sector funder accepts. The work is mechanical once the framework is in place. Pre-event you measure qualification and match acceptance. During the event you measure completion and satisfaction. After the event you measure follow-up speed and booking conversion. Layer the multi-stakeholder model on top, run the standard formula and add the Destinations International DMO-ROI variant for public reporting.
Once you have a year of data measured the same way, the second-year report writes itself. The third year buys you board credibility, because the trend lines now mean something.
If you want to see how Converve handles hosted buyer programmes for DMOs and convention bureaus, book a demo — we will walk through the KPI panel built around the framework above.
Frequently Asked Questions
What is a good ROI ratio for a tourism trade show?
The CEIR/Trade Show Bureau industry baseline is 4:1, meaning four units of revenue for every unit invested. Well-run hosted buyer programmes regularly reach 6:1 to 10:1 because pre-qualified meetings convert at higher rates than open-floor traffic.
How do DMOs measure ROI differently from exhibitors?
DMOs use the Destinations International formula (visitor spending generated divided by DMO operating cost) and a separate tax-return-on-public-funding metric, on top of the standard revenue-divided-by-investment calculation. Public-sector accountability and economic-impact multipliers matter.
Which KPIs matter most for a hosted buyer programme?
Five core KPIs: buyer qualification rate, meeting acceptance rate, meeting completion rate, follow-up response rate within 48 hours and lead-to-booking conversion at 90 days. Layer net promoter score across buyer and seller cohorts for satisfaction s